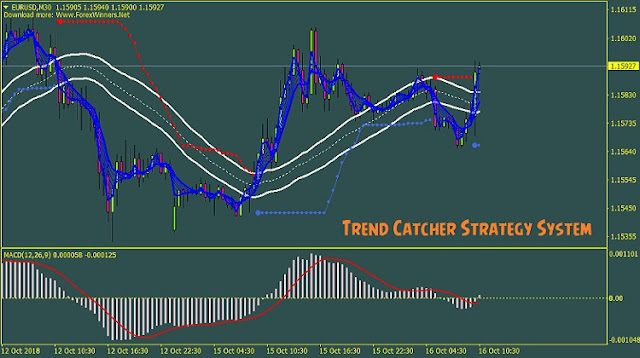
Newbie or expert trader can use this effective and powerfull system, with clean appearance and clear signals that produced. It suit to any currency pair and aplicable to any timeframe window available on trading platform.
 |
| Trend Catcher Strategy System |
INDICATORS:
MA High & Low: These are 35 period moving averages applied to price bar high and low which forms a channel top and bottom. If price bar closes above their levels a bullish trend is occuring and if closes below the levels indicates bearish trend.SMA: This is a 35 period simple moving average applied to price close which is a middle line of MA High & Low channel. If price bars above its level indicates uptrend and below its level indicates downtrend of the market.
SMA Set: It is a collection of simple moving average with various parameters from 2 to 8 periods this group form a wave which used to determine major trend. The crossovers of these moving average lines within this wave can be used as trading signal. In case of bullish trend smaller period will stays above the larger period moving averages and if happens the bearish trend the opposite scenario will be happened.
BBands: This indicator plots the dynamic exit level, appears above and below price chart that assists the traders to update their stop loss levels depend to price movement levels.
MACD: It is a well known as momentum based indicator. If its value above zero line indicates the bullish momentum and below the zero line tell the bearish momentum.
 |
| Trend Catcher Strategy System Indicators |
RULE of Trend Catcher Strategy System
BUY Entry- Price bar rise and closes above MA high and SMA level
- SMA Set crossover indicates bullish trend
- BBands should appears below the price bars with blue dots
- MACD value should be above zero level
- Place Buy entry when the conditions above are met
- Place stop loss below the BBands level
- Exit Buy order and take profit whenever price bar closes downward in between MA High & Low lines.
 |
| Trend Catcher Strategy System Buy condition |
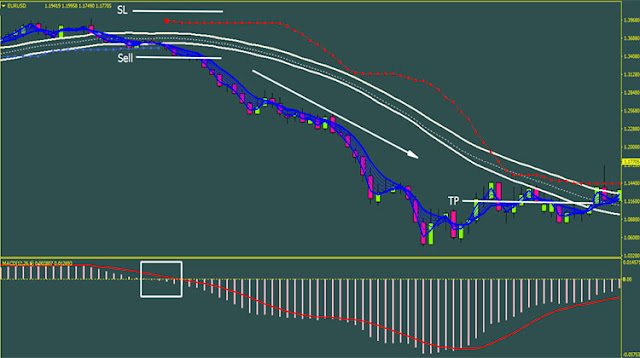
- Price bar fall and closes below MA low and SMA level
- SMA Set crossover indicates bearish trend
- BBands should appears above the price bars with red dots
- MACD value should be below zero level
- Place Sell entry when the conditions above are met
- Place stop loss above the BBands level
- Exit Sell order and take profit whenever price bar closes upward in between MA High & Low lines.
 |
| Trend Catcher Strategy System Sell condition |


0 Response to "Trend Catcher Strategy System"
Post a Comment